GPS Graphic
Description
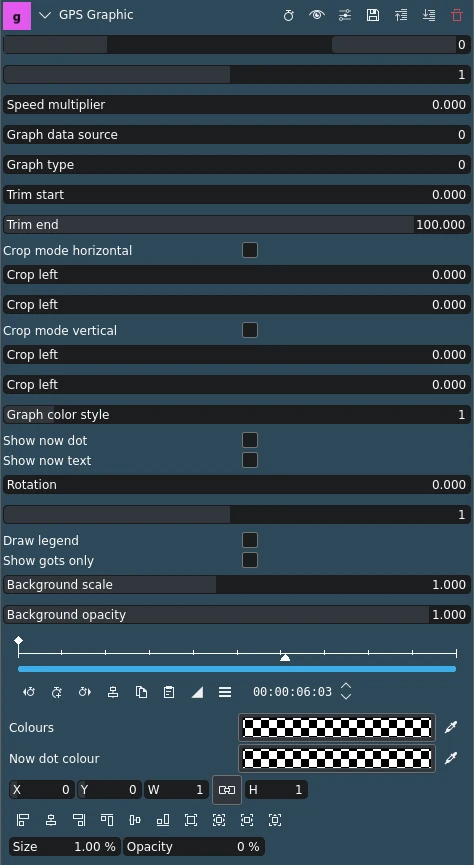
This effect/filter overlays GPS-related graphics onto the video.
Parameters
Parameter |
Value |
Description |
|---|---|---|
Offset |
Integer |
An offset (in seconds) to be added to the video file to match it to the GPS track. Most of the time this willTrim start at least need to be set to the timezone difference between the two files plus some seconds if the video recording device isn’t precisely set to correct time. GPS time is always exact and in UTC[1]. Use positive values if GPS is ahead of video and negative otherwise. |
Smoothing level |
Integer |
How many GPS points to smooth in order to eliminate GPS errors. A value of 1 does not smooth locations, it only calculates the extra fields (speed, distance, etc) it also interpolates missing values for heart rate and altitude. |
Speed multiplier |
Float |
If the video file is a timelapse (or slow motion), use this value to set the speed up/slow down ratio. Sample values: 30 for 30x timelapse, 0.25 for 4x slow motion footage. |
Graph data source |
Integer |
What data from the GPS file is used for drawing: 0 = GPS location/track; 1 = altitude (if available); 2 = heart rate (if available); 3 = speed (always available, computed from location) |
Graph type |
Integer |
How to draw the selected data: 0 = a basic 2D map line (for location) or 1D graph per time (others); 1 = zooms in onto the map/graph and centers around the current location[2]; 2 = draws a speedometer (available for all data sources but recommended only for speed; for the map type it represents the «percentage done» from trimmed start - end) |
Trim start |
Percent |
Trim data from the start of the GPS file (as a percentage of total). Note: both Trim start and Trim end are computed from the total file so trimming 50% start and 50% end will result in trimming the entire file. |
Trim end |
Percent |
Trim data from the end of the GPS file (as a reversed percentage of total, ie: 100 means no trim, 50 means half of total file, 5 means trim 95% of the file). Note: both Trim start and Trim end are computed from the total file so trimming 50% start and 50% end will result in trimming the entire file. |
Crop mode horizontal |
Switch |
Decides how to interpret the Crop left and Crop right values: 0 = a percentage from min..max; 1 = an absolute value (ie: it can crop between 22.2 and 22.3 degrees of longitude)[3] |
Crop left |
Float |
Crops data from the left side of the graph (effectively zooming in). The value is interpreted either as a percentage of total or an absolute value depending on Crop mode horizontal. In percentage mode the values are not restricted to 0-100 to allow for «zoom out» behaviour (ie: cropping -50 left will add an extra half of the total horizontal distance). Values over 100 (in % mode) will effectively not display anything. If Graph type is speedometer, all crop left/right values are ignored. |
Crop right |
Float |
Same as Crop left but for the right side and percentage type is interpreted as an inverse percentage (ie: 100 = do not crop anything). Values under 0 will effectively not display anything. |
Crop mode vertical |
Switch |
Decides how to interpret the Crop top and Crop bottom values: 0 = a percentage from min..max; 1 = an absolute value (ie: it can zoom in to between 100 and 150m of altitude to show small changes in altitude between those 2 values better)[4] |
Crop bottom |
Float |
Crops data from the bottom side of the graph (effectively zooming in). The value is interpreted either as a percentage of total or an absolute value depending on Crop mode vertical. In percentage mode the values are not restricted to 0-100 to allow for «zoom out» behaviour (ie: cropping -50 bot will add an extra half of the total vertical distance to the bottom). Values over 100 (in % mode) will effectively not display anything. If Graph type is speedometer, this will set the minimum needle position which will clamp all values that are lower. |
Crop top |
Float |
Same as Crop bottom but for the top side and percentage type is interpreted as an inverse percentage (ie: 100 = do not crop anything). Values under 0 will effectively not display anything. |
Graph color style |
Selection |
Chooses one of the 9 styles to draw the graph line |
Show now dot |
Switch |
Enable it to draw a disc at the current location/time over the graph line. If graph type is speedometer, this affects the needle. |
Show now text |
Switch |
Enable it to draw the current value in big white bold letters on the bottom right side of the rect. The legend_unit value will be appended at the end and it will be used as the current unit (if a valid unit is found ie: kilometers if «km» is found anywhere in the legend_unit string). |
Rotation |
Float |
Rotate the entire graph rect. For speedometer type the text stays horizontal. |
Thickness |
Integer |
Sets the thickness of the line graph in px |
Draw legend |
Switch |
If enabled it will draw 5 horizontal (and vertical for map type) lines with small values each corresponding to the current data source value at 0%, 25%, 50%, 75% and 100% of current graph shown, affected by the legend_unit type if applicable and with the string appended to the value. For Graph type speedometer this shows division values (but without appending unit). |
Show dots only |
Switch |
If enabled, the graph will be drawn using individual dots instead of lines. This will effectively show the individual data points as affected by Smoothing (ie: for location data it will display each GPS fix if smoothing is 1) and can either be used as a cool effect when zoomed in enough or to debug unexpected line jumps. |
Background scale |
Float |
Scale the background image (relative to center) to match it to the above GPS track. Values smaller than 1 zoom into the image, values larger than 1 zoom out. 0 hides it. |
Background opacity |
Float |
Sets the opacity of the background image |
Colours |
Picker |
Sets the colors of the graph line |
Now dot colour |
Picker |
Choose the outer circle color of the now dot disc. The size of this circle is the same as the line thickness. The inside of the disc is always white. If the alpha value of the color is 0 (default) this will use the same color as the nearby (or past) line (including for gradient types) thus effectively making it change color in time. |
The following selection items are available:
Graph color style
0 |
one color -> same color and size for the entire graph |
1 |
two colors -> same as 2 and 3 but the entire line is the same thickness |
2 |
solid past, thin future -> from the beginning of the graph to the current position (=»past») it will be drawn using the 1st color and chosen thickness, but for the «future» part of the graph it will use the 2nd color and thickness will be 2px (or 1px if main thickness is below 3) |
3 |
solid future, thin past |
4 |
vertical gradient -> the line will be coloured as a vertical gradient relative to the entire rect area |
5 |
horizontal gradient |
6 |
color by duration -> the selected colors will be used as a gradient, in chronological time (except for location source, this will effectively be a left to right gradient for 1D graphs) |
7 |
color by altitude -> the selected colors will be used as a gradient from the minimum altitude value from file to the maximum one, not affected by crops or trim |
8 |
color by heart rate |
9 |
color by speed -> same as above but gradient is affected by smoothing |