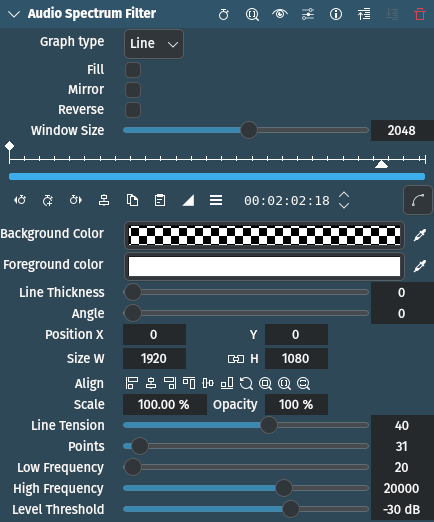
Audio Spectrum Filter

Description
This effect/filter is an audio visualization effect that draws an audio spectrum on the image. It can be controlled directly on the monitor.
Parameters
Parameter |
Value |
Description |
|---|---|---|
Graph type |
Selection |
Select the type of graph to display the levels |
Fill |
Switch |
If checked, fills the area under the graph. Only applies to Graph type Line. |
Mirror |
Switch |
If checked, mirrors the spectrum on the center line of the rectangle |
Reverse |
Switch |
If checked, draws the points starting with the highest frequency |
Window size |
Integer |
The number of samples that the FFT[1] will be performed on. If Window size is less than the number of samples in a frame, extra samples will be ignored. If Window size is more than the number of samples in a frame, samples will be buffered from previous frames to fill the window. The buffering is performed as a sliding window so that the most recent samples are always transformed. |
Background Color |
Picker |
Defines the background color to be applied to the entire frame |
Foreground color |
Picker |
Defines the color of the waveform |
Line Thickness |
Integer |
Defines the thickness of the bar or line in number of pixels |
Angle |
Integer |
Defines the rotation angle to be applied to the waveform |
X / Y / W / H / Size / Opacity |
Defines the X and Y coordinates, Width and Height, Size and Opacity of the rectangle in which the waveform is drawn. The icons help in lining up the rectangle. |
|
Line Tension |
Integer |
Affects the amount of curve in the line interpolating between points. 0 draws a straight line between points; 100 draws very curved lines between points. Values below 0 and above 100 will cause loops in the lines. Only applies to Graph type Line. |
Points |
Integer |
Defines the number of bands to draw in the spectrum. Each band shows up as a data point in the graph. |
Low Frequency |
Integer |
The low end of the frequency range to be used for the graph (Hz) |
High Frequency |
Integer |
The high end of the frequency range to be used for the graph (Hz) |
Level Threshold |
Integer |
The minimum amplitude of sound that must occur within the frequency range to cause the value to be applied (dB) |
The following selection items are available:
Graph type
Line |
|
Bar |
Note
The effect is not updated in the Project Monitor during scrubbing. You need to play back the project to see this effect.
Tip
Opacity is fixed at 100%. You control the opacity/transparency of the effect by adjusting the alpha component of the Foreground color.
Example

Example of the Audio Spectrum Filter effect
Line Thickness set to 4