Visualizar espectro de audio
Descripción
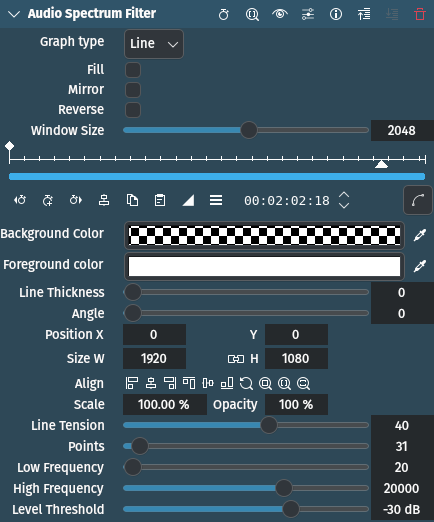
Este es un efecto de visualización de audio que dibuja un espectro de audio sobre la imagen de un clip. Podrá ser controlado directamente desde el Monitor.
Parámetros
Parámetro |
Valor |
Descripción |
|---|---|---|
Tipo de gráfica |
Selección |
Permitirá escoger un tipo de gráfica para mostrar los niveles del audio |
Rellenar |
Interruptor |
Cuando esté activa, rellenará el área debajo de la gráfica. Solo se aplica al Tipo de gráfica Líneas. |
Simetrizar |
Interruptor |
Cuando esté activa, creará un espectro simétrico sobre el centro del marco del efecto |
En reversa |
Interruptor |
Cuando esté activa, dibujará los puntos comenzando con los de mayor frecuencia a la izquierda |
Tamaño de ventana |
Entero |
La cantidad de muestras sobre las que se calculará la FFT[1]. En caso de que Tamaño de ventana fuera inferior a la cantidad de muestras en un fotograma, las muestras adicionales serán ignoradas. En caso de que Tamaño de ventana sea superior a la cantidad de muestras en un fotograma, las muestras serán mantenidas desde los fotogramas anteriores, para completar la ventana. El proceso de preservación de las muestras anteriores será realizado en forma de ventana deslizante, por lo que las muestras más recientes siempre serán transformadas. |
Color de fondo |
Selector |
Definirá el color de fondo a ser aplicado al marco del efecto |
Color principal |
Selector |
Definirá el color de la forma de onda |
Grosor de línea |
Entero |
Definirá el grosor de las barras o de las líneas, expresado en píxeles |
Ángulo |
Entero |
Definirá el ángulo de rotación a ser aplicado a la forma de onda |
Posición X / Y / An / Al / Escala / Opacidad |
Definirá las coordenadas X e Y de traslación, el Ancho y la Altura, el Tamaño y la Opacidad del marco en donde se dibujará la gráfica. Los íconos ayudarán a alinear el marco. |
|
Tensión de línea |
Entero |
Afectará la definición de las curvas que interpolan entre los puntos de la gráfica. Con un valor de 0 se dibujarán líneas rectas; con 100 líneas muy detalladas. Valores por debajo de 0 y por encima de 100 producirán bucles en las líneas. Solo se aplica al Tipo de gráfica Líneas. |
Puntos |
Entero |
Definirá la cantidad de bandas a ser dibujadas en el espectro. Cada banda se mostrará como un punto de datos en la gráfica. |
Frecuencia baja |
Entero |
El extremo inferior del rango de frecuencias usado para la gráfica (expresado en Hz) |
Frecuencia alta |
Entero |
El extremo superior del rango de frecuencias usado para la gráfica (expresado en Hz) |
Umbral de nivel |
Entero |
La amplitud mínima del audio que deberá producirse dentro del rango de frecuencias, para causar que el valor sea aplicado (expresado en dB) |
Los siguientes elementos se encuentran disponibles para ser seleccionados:
Tipo de gráfica
Líneas |
|
Barras |
Nota
El efecto no se actualizará mientras se esté arrastrando el cursor de tiempo. Será necesario reproducir el proyecto para ver el efecto.
Truco
La Opacidad se encuentra fija en un valor de 100 %. Será posible controlar la opacidad del efecto ajustando el componente alfa del Color principal.
Ejemplo

Ejemplo del efecto Visualizar espectro de audio
Grosor de línea establecido en 4