Grafico GPS
Descrizione
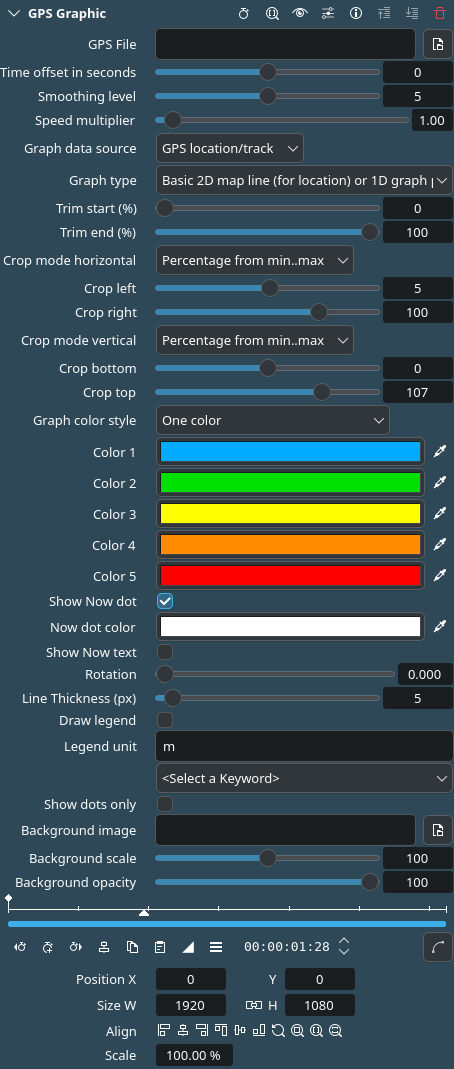
Questo effetto/filtro sovrappone i grafici collegati al GPS sul video.
Parametri
Parametro |
Valore |
Descrizione |
|---|---|---|
File GPS |
Apri file |
Seleziona un file con i dati del GPS. I formati supportati sono |
Scostamento temporale in secondi |
Intero |
Uno scostamento in secondi da aggiungere al file video per farlo corrispondere alla traccia GPS. La maggior parte delle volte dovrà essere impostato almeno sulla differenza di fuso orario tra i due file, più alcuni secondi se il dispositivo di registrazione video non è impostato con precisione all’orario corretto. Il tempo del GPS è sempre esatto e in UTC[1]. Usa dei valori positivi se il GPS è in anticipo sul video, altrimenti negativi. |
Livello di smussatura |
Intero |
Quanti punti GPS smussare per eliminare gli errori GPS. Un valore di 1 non smussa le posizioni, calcola solo i campi extra (velocità, distanza, ecc.), e interpola anche i valori mancanti per la frequenza cardiaca e l’altitudine. |
Moltiplicatore di velocità |
Virgola mobile |
Se il file video è un time lapse (o una ripresa a rallentatore), usa questo valore per impostare aumentare/diminuire la velocità. Valori campioni: 30 per 30x di time lapse, 0,25 per filmati a rallentatore 4x. |
Fonte dati grafico |
Selezione |
Quali dati dal file GPS sono usati per la rappresentazione. Le opzioni sono Posizione/Traccia GPS (quella predefinita), Altitudine (se disponibile), Frequenza cardiaca (se disponibile), e **Velocità (sempre disponibile, calcolata dalla posizione) |
Tipo di grafico |
Selezione |
Come rappresentare i dati selezionati. Le opzioni sono Mappa a 2D semplice (per le posizioni) o un grafico a 1D per il tempo (altro), Ingrandisci sulla mappa/grafico e centra attorno alla posizione corrente[2], Disegna un tachimetro (disponibile per tutte le sorgenti dati, ma raccomandato solo per la velocità; per il tipo di mappa rappresenta la «percentuale completata» dall’inizio/fine tagliato) |
Taglia all’inizio |
Percentuale |
Taglia i dati dall’inizio del file GPS (come percentuale del totale). Nota: entrambe le opzioni Taglia all’inizio e Taglia alla fine vengono calcolate dal file totale, dunque ritagliare il 50% dell’inizio e il 50% della fine porterà al taglio dell’intero file. |
Taglia alla fine |
Percentuale |
Taglia i dati dalla fine del file GPS (come percentuale inversa del totale, ossia 100 indica nessun taglio, 50 indica metà del file totale, 5 indica il taglio del 95% del file). Nota: entrambe le opzioni Taglia all’inizio e Taglia alla fine vengono calcolate dal file totale, dunque ritagliare il 50% dell’inizio e il 50% della fine porterà al taglio dell’intero file. |
Modalità taglio orizzontale |
Interruttore |
Decide come interpretare i valori Taglia a sinistra e Taglia a destra: Percentuale da min..max, o Valore assoluto (ossia può ritagliare tra 22.2 e 22.3 gradi di longitudine)[3] |
Taglia a sinistra |
Virgola mobile |
Ritaglia i dati dal lato sinistro del grafico (di fatto ingrandito). Il valore è interpretato o come percentuale del totale o come valore assoluto, a seconda dell’opzione Modalità taglio orizzontale. Nella modalità percentuale, i valori non sono ristretti a 0-100 in modo da consentire comportamenti di «rimpicciolimento» (ossia, il ritaglio di -50 a sinistra aggiungerà una metà extra della distanza orizzontale totale). I valori oltre 100 (in modalità percentuale) di fatto non visualizzeranno alcunché. Se Tipo di grafico è Tachimetro, tutti i valori di ritaglio a sinistra/destra saranno ignorati. |
Taglia a destra |
Virgola mobile |
Uguale a Taglia a sinistra ma per il lato destro; il tipo percentuale viene interpretato come percentuale inversa (ossia 100 = non ritaglia nulla). I valori sotto lo zero di fatto non visualizzeranno alcunché. |
Modalità taglio verticale |
Interruttore |
Decide come interpretare i valori Taglia in alto e Taglia in basso: Percentuale da min..max, o Valore assoluto (ossia, può ingrandire tra 100 e 150 m di altitudine per mostrare meglio le piccole modifiche nell’altitudine tra quei due valori)[4] |
Taglia in basso |
Virgola mobile |
Ritaglia i dati dal lato inferiore del grafico (di fatto ingrandito). Il valore è interpretato o come percentuale del totale o come valore assoluto, in base all’opzione Modalità taglio verticale. In modalità percentuale, i valori non sono ristretti a 0-100 in modo da consentire comportamenti di «rimpicciolimento» (ossia il ritaglio di -50 bot aggiungerà una metà extra della distanza verticale totale alla parte inferiore). I valori oltre 100 (in modalità percentuale) di fatto non visualizzeranno alcunché. Se Tipo di grafico è Tachimetro, sarà impostato la posizione minima della lancetta che bloccherà tutti i valori inferiori. |
Taglia in alto |
Virgola mobile |
Uguale a Taglia in basso ma per il lato superiore; il tipo percentuale viene interpretato come percentuale inversa (ossia 100 = non ritaglia nulla). I valori sotto lo zero di fatto non visualizzeranno alcunché. |
Stile del colore del grafico |
Selezione |
Scegli uno dei nove stili per disegnare la linea del grafico (per le opzioni vedi sotto) |
Mostra il punto Adesso |
Interruttore |
Abilita la rappresentazione di un disco nella posizione/tempo corrente sulla linea del grafico. Se il tipo di grafico è il tachimetro, influenzerà la lancetta. |
Colore del punto Adesso |
Selettore |
Scegli il colore del cerchio esterno del disco «nuovo punto». La dimensione del cerchio è la stessa dello spessore della linea. L’interno del disco è sempre bianco. Se il valore alfa del colore è 0 (predefinito), esso utilizzerà lo stesso colore della linea vicina (o precedente), incluso per i tipi con sfumatura, pertanto cambiandogli in realtà il colore nel tempo. |
Mostra il testo di Adesso |
Interruttore |
Abilita la rappresentazione del valore corrente in grandi lettere bianche in grassetto, sul lato inferiore destro della retta. Sarà aggiunto il valore legend_unit alla fine e sarà utilizzato come unità corrente (se viene trovata un’unità valida, ossia: chilometri, se «km» viene trovato in qualsiasi parte della stringa legend_unit). |
Rotazione |
Virgola mobile |
Ruota l’intera retta del grafico. Per il tipo tachimetro, il testo rimane orizzontale. |
Spessore della linea (px) |
Intero |
Imposta lo spessore della linea del grafico in px |
Mostra legenda |
Interruttore |
Se abilitato, disegnerà cinque linee orizzontali (e verticali per il tipo mappa) con piccoli valori, ciascuno corrispondente al valore della sorgente dati corrente a 0%, 25%, 50%, 75% e 100% del grafico corrente mostrato, influenzato dal tipo legend_unit, se applicabile, e con la stringa allegata al valore. Per il Tipo di grafico Tachimetro, mostra valori di divisione (ma senza unità allegata). |
Unità leggenda |
Campo testuale |
Seleziona l’unità di misura dei dati da visualizzare dalla lista sotto. In questo campo puoi aggiungere del testo. |
Mostra solo i punti |
Interruttore |
Se abilitato, il grafico sarà rappresentato utilizzando punti singoli anziché linee. Ciò mostrerà, di fatto, i punti dati singoli come influenzati dall’opzione :guilabel:Smussatura` (ossia, per i dati di posizione mostrerà ogni punto fisso GPS, se «smussatura» è impostata 1) e può essere utilizzata sia per creare un effetto carino quando si ingrandisce a sufficienza, sia per eseguire il debug di salti di linea inaspettati. |
Immagine di sfondo |
Selezione file |
Apre un file immagine che verrà usato come sfondo per il grafico GPS |
Ridimensiona sfondo |
Virgola mobile |
Ridimensiona l’immagine di sfondo (relativa al centro) in modo da coincidere con la traccia GPS soprastante. I valori inferiori a 1 ingrandiscono all’interno dell’immagine, i valori superiori a 1 rimpiccioliscono. 0 la nasconde. |
Opacità dello sfondo |
Virgola mobile |
Imposta l’opacità dell’immagine di sfondo |
Colori |
Selettore |
Imposta i colori della linea del grafico |
Per lo Stile del colore del grafico sono disponibili le seguenti opzioni:
Un colore |
Stesso colore e stessa dimensione per l’intero grafico |
Due colori |
Come Precedente consistente o successivo sottile, ma l’intera linea è di spessore uniforme |
Precedente consistente, successivo sottile |
Dall’inizio del grafico alla posizione attuale (=«precedente») sarà disegnato utilizzando il primo colore e lo spessore scelto, ma per la parte «successiva» del grafico verrà utilizzato il secondo colore e lo spessore sarà di 2 px (o 1 px, se lo spessore principale è inferiore a 3) |
Successivo consistente, precedente sottile |
Come sopra, ma al contrario |
Sfumatura verticale |
La linea sarà colorata come una sfumatura verticale relativa all’intera area della retta |
Sfumatura orizzontale |
Come sopra, ma orizzontale |
Colora per durata |
I colori selezionati saranno utilizzati come sfumatura, in ordine cronologico (ad eccezione dell’origine della posizione, sarà sostanzialmente una sfumatura da sinistra a destra per dieci grafici) |
Colora per altitudine |
I colori selezionati saranno utilizzati come sfumatura dal valore di altitudine minimo, presente nel file, a quello di altitudine massima, non influenzata da ritagli |
Colora per frequenza cardiaca |
I colori selezionati saranno utilizzati come sfumatura dal valore di frequenza cardiaca minima, presente nel file, a quello di altitudine massima |
Colora per velocità |
Uguale alla precedente, ma la sfumatura è influenzata dalla smussatura |