Monitor de forma de onda de video
Descripción**Descripción**
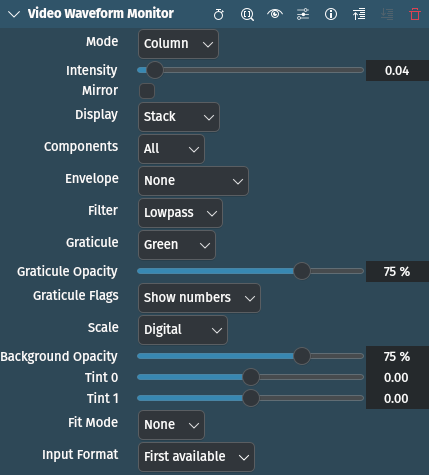
This effect/filter plots color component intensity. By default luminance only. Each column of the waveform corresponds to a column of pixels in the source video.
Ver también
Parámetros
Parámetro |
Valor |
Descripción**Descripción** |
|---|---|---|
Modo |
Selección |
Select the orientation of the waveform: rows or columns |
Intensidad |
Decimal |
Set intensity. Smaller values are useful to find out how many values of the same luminance are distributed across input rows/columns. Default value is 0.04. Allowed range is [0, 1]. |
Simetrizar |
Interruptor |
Set mirroring mode. In mirrored mode, higher values will be represented on the left side for row mode and at the top for column mode. Default is Off. |
Mostrar |
Selección |
Set display mode. See below for options and explanation. |
Componentes |
Entero |
Set which color components to display. Values represent different planes (see below). |
Envolvente |
Selección |
Set envelope. See below for options and explanation. |
Filtro |
Selección |
Set the filter to apply. See below for options and explanation. |
Retícula |
Selección |
Select which graticule to display. See below for options. |
Opacidad retícula |
Percentage |
Set graticule opacity |
Indicadores |
Selección |
Set graticule flags. See below for options. |
Escala |
Selección |
Set scale used for displaying graticule. See below for options. |
Opacidad del fondo |
Percentage |
Set background opacity |
The following selections are available:
Modo
Valor |
Descripción |
|---|---|
Fila |
Graph on the left side represents color component value 0 and the right side represents value = 255 |
Columna |
Top side represents color component value = 0 and bottom side represents value = 255. |
Mostrar
Valor |
Descripción |
|---|---|
Overlay |
Presents information identical to Parade, except that the graphs representing color components are superimposed directly over one another. This display mode makes it easier to spot relative differences or similarities in overlapping areas of the color components that are supposed to be identical, such as neutral whites, grays, or blacks. |
Stack (default) |
Display separate graph for the color components side by side in row mode or one below the other in column mode. |
Parade |
Display separate graph for the color components side by side in column mode or one below the other in row mode. Using this display mode makes it easy to spot color casts in the highlights and shadows of an image, by comparing the contours of the top and the bottom graphs of each waveform. Since whites, grays, and blacks are characterized by exactly equal amounts of red, green, and blue, neutral areas of the picture should display three waveforms of roughly equal width/height. If not, the correction is easy to perform by making level adjustments to the three waveforms. |
Componentes
Valor |
Descripción |
|---|---|
Y |
Luma o luminancia |
U |
azul menos luma |
. |
. |
V |
rojo menos luma |
. |
. |
. |
. |
All |
YUV (default) |
Envolvente
Valor |
Descripción |
|---|---|
None (default) |
Sin envolvente. Predeterminado |
Instant |
Instant envelope, minimum and maximum values presented in graph will be easily visible even with small step value. |
Peak |
Hold minimum and maximum values presented in graph across time. This way you can still spot out of range values without constantly looking at waveforms. |
Peak+Instant |
Peak and instant envelope combined together |
Filtro
Valor |
Descripción |
|---|---|
Lowpass (default) |
Sin filtrado. Predeterminado |
Flat |
|
Aflat |
Similar as above, but shows difference between blue and red chroma. |
Xflat |
Similar as above, but use different colors. |
Yflat |
Similar as above, but again with different colors. |
Chroma |
Displays only chroma |
Color |
Displays actual color value on waveform |
Acolor |
Similar as above, but with luma showing frequency of chroma values. |
Retícula
Valor |
Descripción |
|---|---|
None |
Do not display graticule |
Green (default) |
Display green graticule showing legal broadcast ranges |
Orange |
Display orange graticule showing legal broadcast ranges |
Invert |
Display invert graticule showing legal broadcast ranges |
Indicadores
Valor |
Descripción |
|---|---|
Show numbers (default) |
Dibujará números arriba de las líneas (predeterminado) |
Draw dots |
Draw dots instead of lines |
Escala
Valor |
Descripción |
|---|---|
Digital (default) |
|
Millivolts |
|
IRE |